
Turn fragmented business
data into
clear, actionable insight.
We design and build business analytics, data models and Power BI dashboards that bring together information from ERP, CRM, Excel, SharePoint, Dataverse and other operational systems — helping organisations understand performance, identify risks and make better decisions with greater confidence.
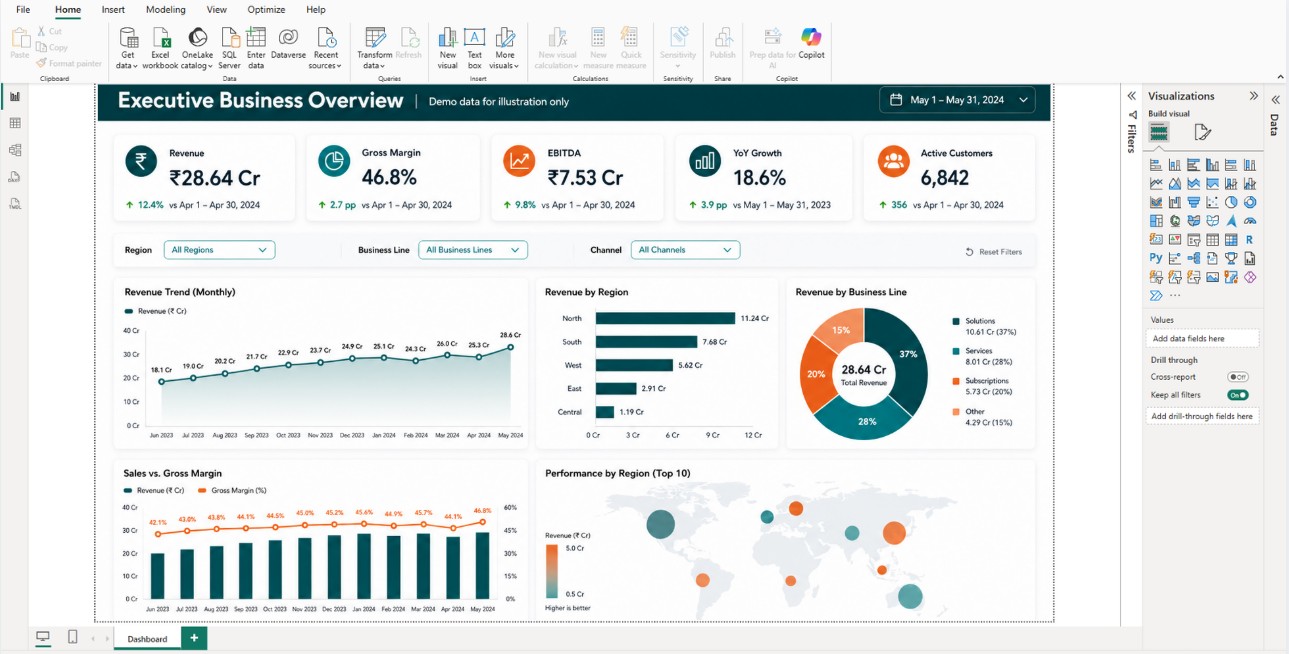
Reporting shouldn't begin with finding the right spreadsheet.
Business information often exists across multiple systems, files and teams. The challenge is not simply having more data — it is creating a reliable view of what is happening and making that information available when decisions need to be made.
Data lives in different places.
ERP, CRM, spreadsheets, SharePoint and operational systems often hold different parts of the business picture.
Reporting depends on manual effort.
Teams spend valuable time extracting, combining and validating information before analysis can even begin.
The same KPI has different answers.
Inconsistent calculations and reporting logic make it difficult to establish a trusted version of performance.
Insights arrive after the decision.
Delayed reporting makes it harder to identify emerging risks, operational bottlenecks and changing performance.
Connect the data. Build trusted metrics. Turn insight into action.
Clean • Relate • Define
Connect data, structure relationships and establish consistent business measures.
Less time preparing reports. More time understanding what the business is telling you.
From raw business data to decision-ready analytics.
We support the complete analytics journey — connecting information, preparing reliable data, defining trusted business measures and delivering Power BI reporting that can be securely used across the organisation.
Bring business data together.
Connect the operational systems, applications and files that contain the information required for analysis.
Build a trusted data foundation.
Transform fragmented information into structured, consistent and reusable analytics models.
Turn metrics into business visibility.
Deliver clear, interactive reporting designed around the decisions different teams need to make.
Make analytics secure and sustainable.
Deploy reporting with the controls, access model and operational practices required for ongoing use.
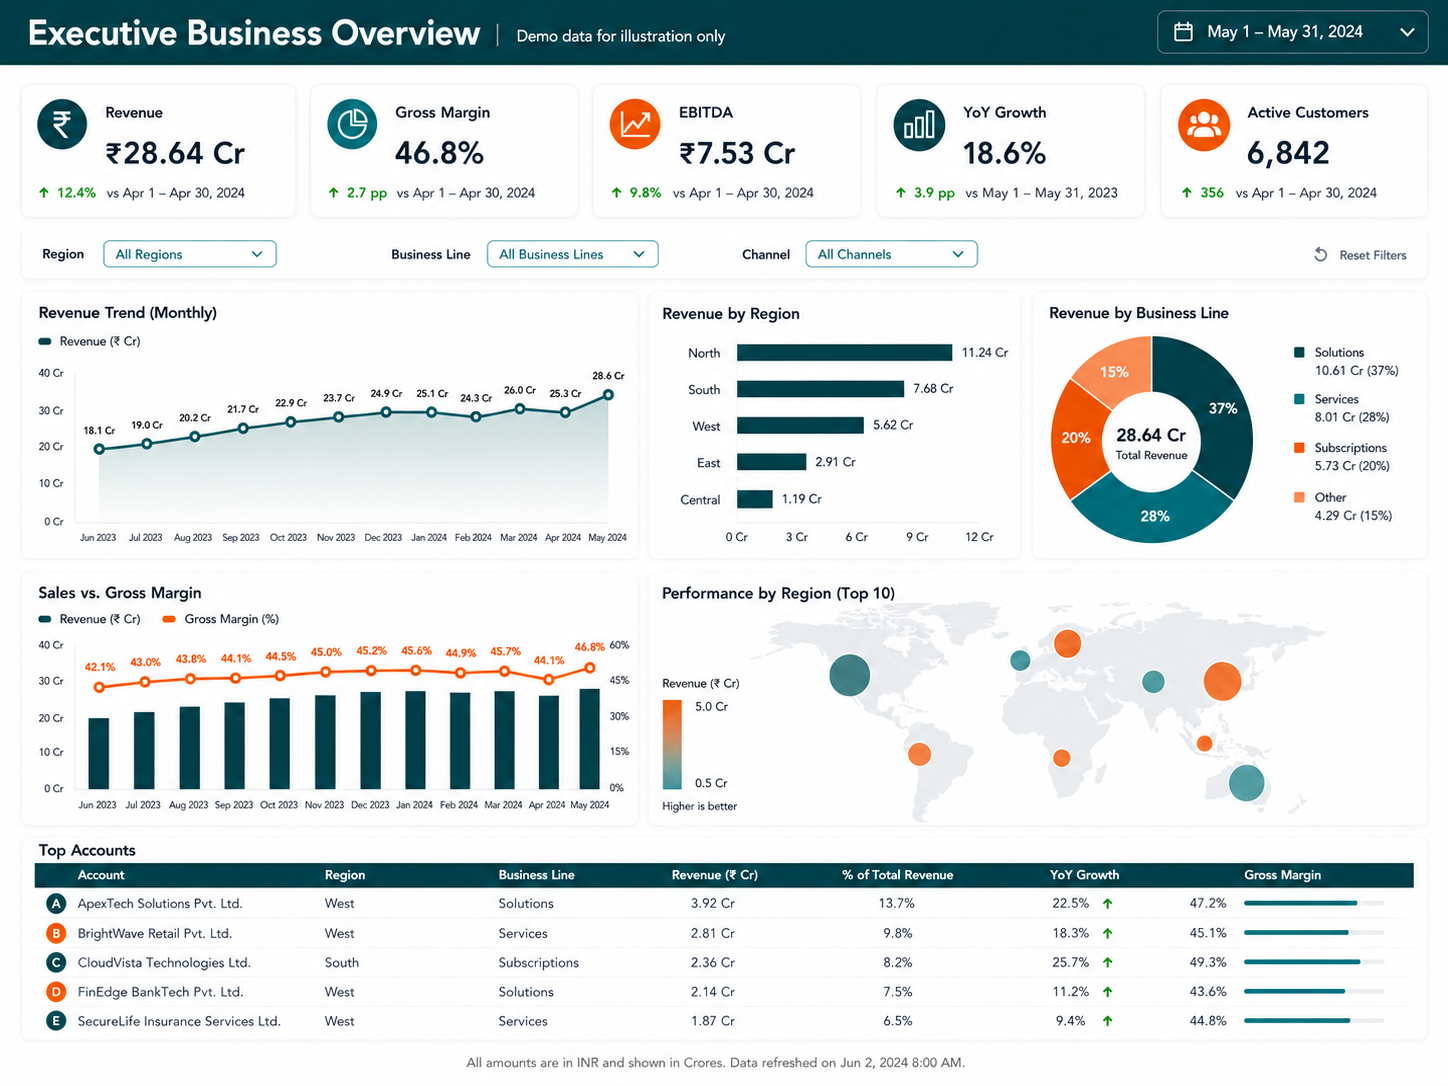
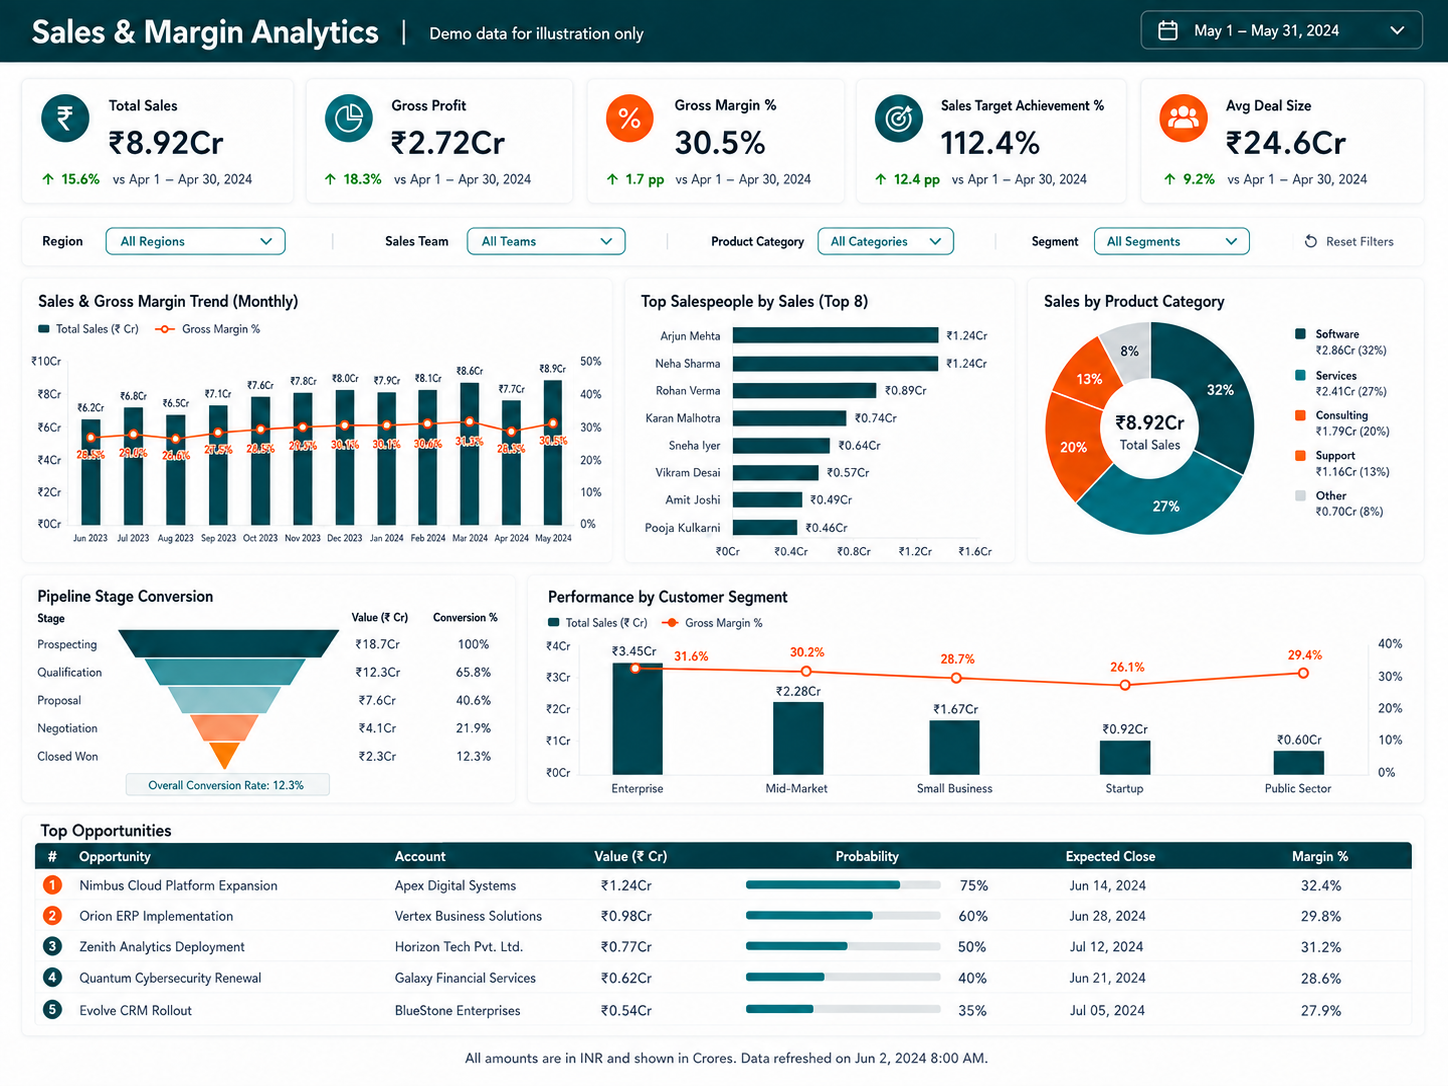
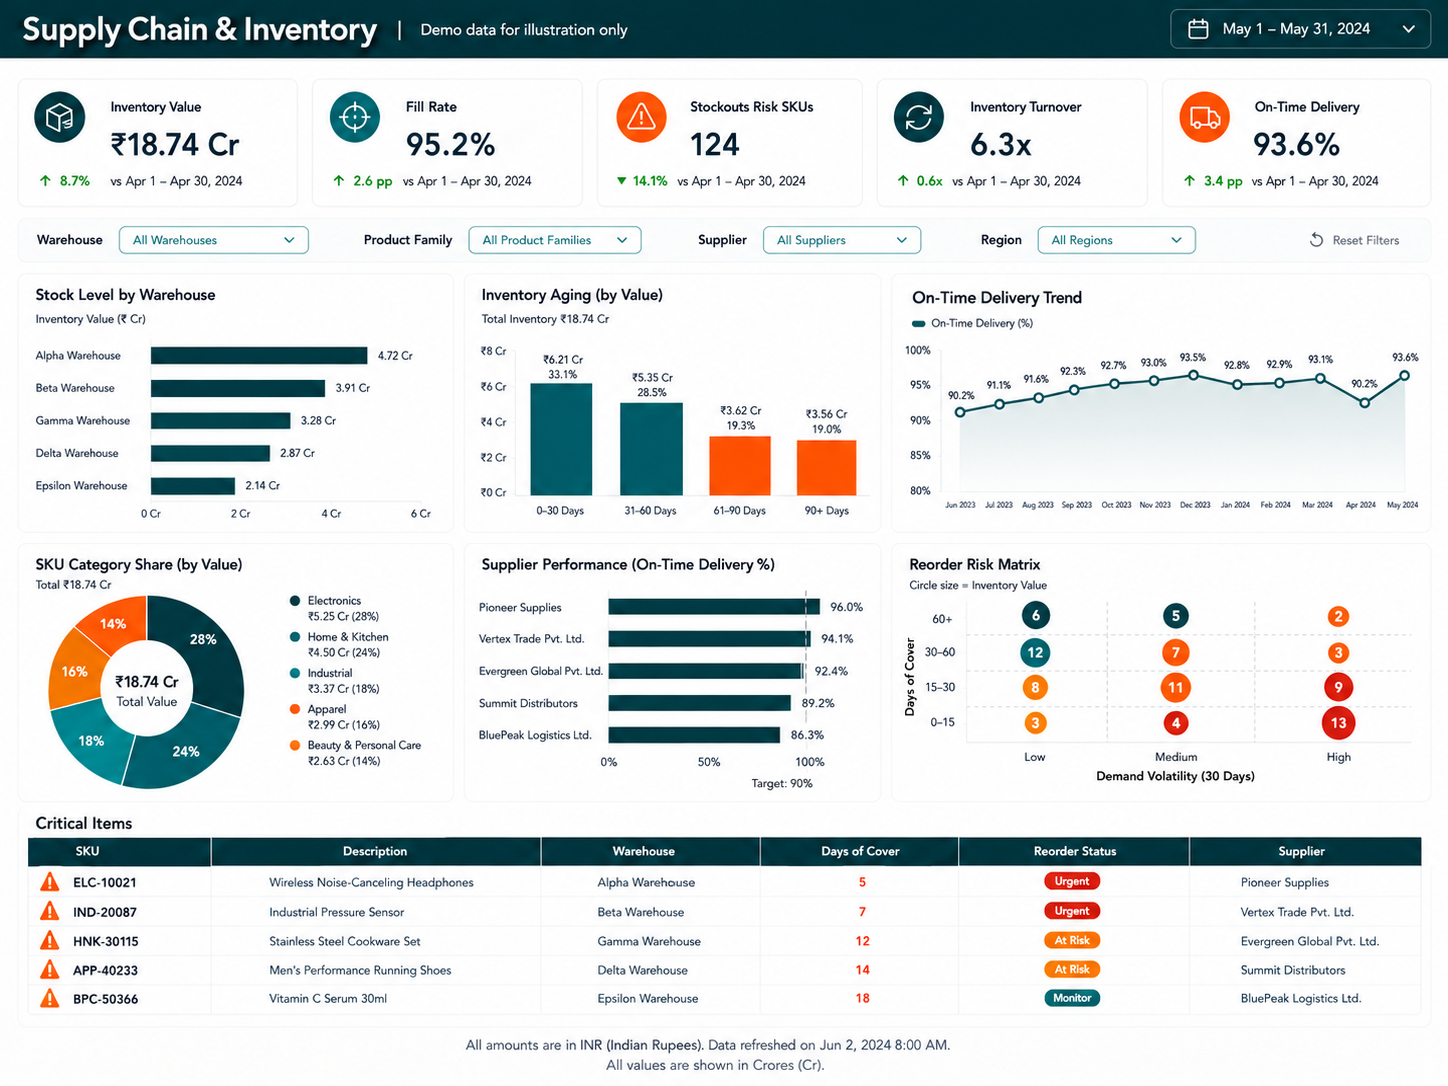
Dashboards designed around real business decisions.
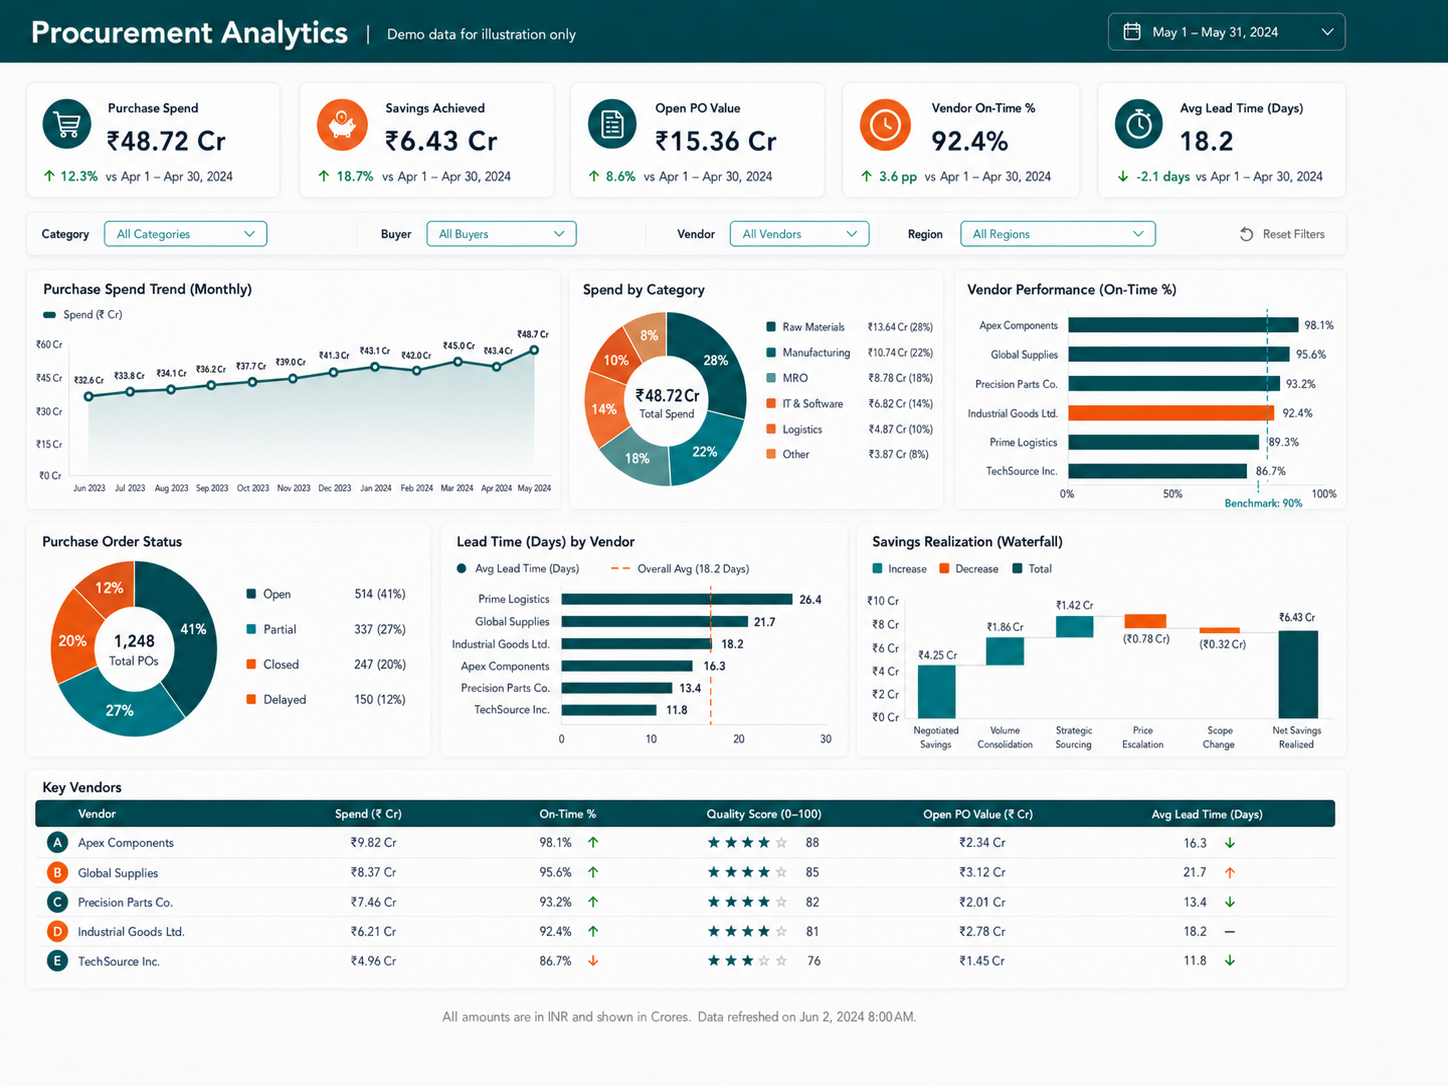
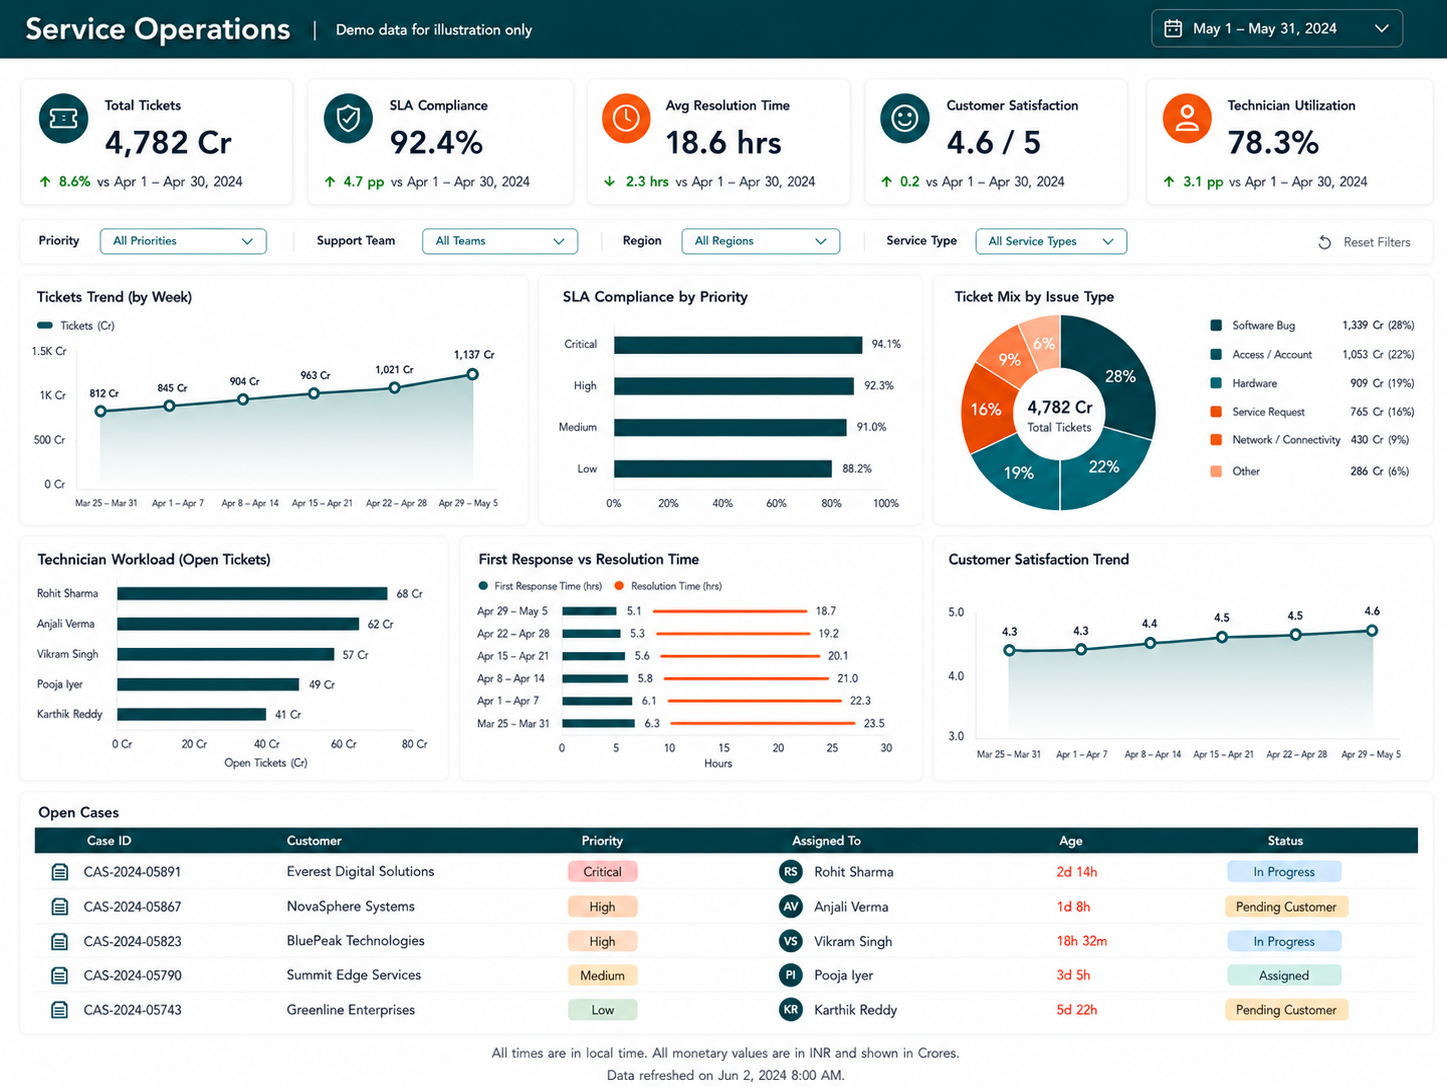
Explore examples of analytics experiences designed around different business roles and operational processes — from executive performance and sales profitability to supply chain, procurement and service operations.
Analytics built around your business.
We combine business understanding, data engineering and Power BI expertise to turn operational information into reliable and decision-ready analytics.
We look beyond dashboard design — bringing together your data, reporting logic, business processes and users into one practical analytics solution.
Business-first analytics
We start with the decisions your teams need to make and build KPIs, data models and visualisations around those requirements.
Real-world data experience
ERP, CRM, Excel, databases, SharePoint and operational systems can be brought together into structured and meaningful reporting.
More than dashboard development
We support data preparation, Power Query, modelling, DAX, security, integrations, automated refresh and reporting optimisation.
Built for maintainability
Solutions are structured so new KPIs, users, business units and data sources can be introduced as reporting evolves.
Security and governance built in
Role-based access, row-level security, workspace structure and publishing controls are considered from the beginning.
Focused on adoption and outcomes
We design reports that help users quickly understand performance, identify exceptions and focus on the actions that matter.
Connect the systems your business already uses.
Power BI becomes significantly more valuable when information from multiple systems is brought together into one trusted reporting model. We help organisations connect, prepare and structure data across operational platforms.
Questions about turning data into decisions.
Practical answers around data sources, Power BI, reporting, dashboards, automation, governance and analytics delivery.
Understanding Analytics & Insights
01 What does a Data Analytics & Insights engagement typically include?
A typical engagement begins by understanding the business questions you need to answer, the available data sources and how information is currently reported.
Depending on the requirement, the engagement may include data preparation, data modelling, Power BI dashboards, KPI design, automated reporting, data integration and ongoing analytics support.
02 Do we need a modern data platform before starting analytics?
No. Many organisations begin with the systems and data sources they already have.
Data may currently reside in ERP systems, CRM platforms, Excel, CSV files, SharePoint, SQL databases or other operational applications.
The technology architecture can evolve as reporting requirements, data volumes and governance needs grow.
03 Can you improve dashboards that we already have?
Yes. A new analytics project does not always mean rebuilding everything from the beginning.
Existing Power BI reports and dashboards can be reviewed for data-model design, usability, KPI logic, performance, navigation and visual clarity.
We can then simplify or enhance the existing solution where required.
04 Can analytics be designed for different management levels?
Yes. Different users usually require different levels of detail.
The objective is to provide each audience with the information needed to take action without overwhelming them with unnecessary detail.
Connecting and preparing your data
05 What data sources can be connected to Power BI?
Power BI can work with a wide range of business data sources.
The best integration approach depends on data volume, refresh requirements, source availability and security considerations.
06 Our data is spread across Excel files and different systems. Can it still be consolidated?
Yes. This is a common starting point for analytics projects.
Data from multiple applications and files can often be combined into a common analytical model so users no longer need to manually consolidate reports every time.
Where practical, repetitive data preparation and refresh activities can also be automated.
07 What happens if the source data has quality issues?
Data quality is often one of the most important parts of a successful analytics solution.
During development, we can identify issues such as missing values, inconsistent naming, duplicate records, incorrect mappings or mismatched business definitions.
Where the issue originates in the source process, we also recommend improvements rather than only correcting it inside the report.
08 Can dashboards refresh automatically?
Yes. Where the data source and architecture support it, reporting datasets can be refreshed automatically at scheduled intervals.
The appropriate design depends on whether the source is cloud-based, on-premises, file-based or accessed through an API.
The aim is to reduce manual report preparation and provide users with consistently updated information.
Designing reporting that drives action
09 What types of dashboards can Epicarp build?
Dashboards can be designed around specific business functions, operational processes or management objectives.
10 Can different users see only the data relevant to them?
Yes. Where required, reporting can be designed so that users see data relevant to their role, branch, department, geography or responsibility.
This can help create a single reporting solution while still providing controlled and relevant views for different audiences.
11 Can Power BI provide more than historical reporting?
Yes. Good analytics should help users understand not only what happened, but also where attention is required.
What happened? Historical performance.
Why did it happen? Variance and contributing factors.
Where is the risk? Exceptions and emerging issues.
What needs action? Operational priorities.
The exact analytical approach depends on the available data and business requirement.
12 Can reports be automatically sent to users who do not regularly use Power BI?
In suitable scenarios, reporting workflows can be combined with automation to distribute relevant information to users on a scheduled basis.
For example, business users may receive selected reports, summaries or files through automated workflows based on the organisation's reporting and licensing model.
This can reduce repetitive manual preparation and distribution of operational reports.
From dashboard development to everyday use
13 How do you approach a new analytics project?
We begin with the decisions and business outcomes the report needs to support rather than starting directly with visual design.
Business users are involved during validation so KPI definitions and report behaviour can be confirmed before production rollout.
14 How long does it take to build a Power BI dashboard?
The duration depends on the number of data sources, data quality, integration complexity, number of reports, KPI calculations and stakeholder validation required.
A focused dashboard with readily available data can be delivered much faster than a multi-department reporting programme that requires data consolidation and business-rule standardisation.
15 Can Epicarp support us after the dashboards go live?
Yes. Analytics requirements continue to evolve as business priorities and reporting needs change.
Support can include report enhancements, new KPIs, additional data sources, refresh troubleshooting, performance improvements and new analytical requirements.
16 Can we start with one business area and expand later?
Yes. In many cases, starting with one high-value business area is a practical approach.
For example, an organisation may begin with Sales or Finance analytics and then extend the same reporting foundation into Procurement, Operations, Service or management reporting.